
Motorsport is a field where the pursuit of maximum performance never stops. Teams dedicate themselves intensely to developing and refining competition vehicles. Within this context, using KPIs in motorsport data analysis plays a key role in validating and evaluating car and driver performance.
KPIs are metrics that quantify an organization’s progress toward its objectives and goals. In the context of competition vehicles, KPIs are used to measure and monitor key aspects of car and driver performance, allowing teams to make decisions during a race weekend, and even to track trends across an entire season.
This type of analysis is carried out using software that collects information from a data acquisition system and turns it into graphs. A data engineer is used to analyzing information by looking at every value within a single lap or session. This makes the analysis a micro-level exercise. However, it’s also necessary to look at the macro level to understand how a given variable trends over the course of a session and/or a race weekend.
Some channels have trends that are easy to visualize within data analysis software over the course of a session. A good example is water and oil temperature channels. While these channels vary throughout a lap — tending to rise in low-speed sections and drop on straights — they also tend to rise quickly at the start of a session before stabilizing at an equilibrium temperature. The image below shows temperature evolution over the course of a session.

However, it isn’t intuitive to predict what those equilibrium values will be across every session of the weekend. This is where a KPI tool helps engineers do their job.
Which values should be used as KPIs
Since this is a statistical tool, any information collected can be used as a metric to evaluate driver-car performance. Some information comes directly from the acquisition system, such as fluid temperatures, speed, and brake pressure, among others. Other data comes from math channels such as car balance, steering aggressiveness, or lambda at WOT (wide open throttle). It’s also possible to log metrics that don’t come from the acquisition system, such as ambient and track temperature readings, tire pressures collected with a gauge, vehicle setup parameters, and lap and sector times.
The most widely used KPI is lap time. This indicator is fundamental for evaluating vehicle speed and efficiency — any change made should reduce this indicator to be validated as a genuine performance gain.
The right software for building the report
There’s no single correct software to use — there are several ways to visualize this type of data. The engineer should choose the solution that offers the best balance of ease of use, a friendly interface, and cost, matched to their level of familiarity with the platform. Below is a rundown of solutions used by leading competition teams, starting with low-cost, low-experience-level options and moving up to more complete and complex tools.
Acquisition software
Some software packages, such as MoTeC i2, include a built-in window that already provides KPI functionality within the program. Since it requires no programming and no additional software, this solution is quick for visualizing a trend. That said, its charting capabilities are limited.
Excel
Although it’s the simplest option, Microsoft Excel can also be used to build and calculate KPIs in motorsport. Excel offers advanced data analysis features, custom formulas, and charts, allowing data to be manipulated and visualized efficiently. While less flexible than a programming language, Excel is widely accessible and used by many teams.

The lap-by-lap data from an Endurance race was imported into a spreadsheet, which was used to build the chart above. Analyzing it makes it possible to validate each driver’s consistency, tire degradation, laps under safety car, and pit stop timing.
Power BI
Power BI is an evolution of Excel’s dynamic charts. Its interface is user-friendly and charts are easy to customize. That said, manipulating the data does require some programming knowledge.

The image above shows a dashboard built in Power BI to monitor tire air temperature and pressure during a Porsche Cup Endurance round. Rear-right (RR) wheel data isn’t available due to an antenna issue in the rear-right wheel housing, which receives the signal from that wheel’s TPMS sensor. During the race’s third stint, highlighted by the magenta lines, there’s no signal from the rear-left wheel due to a missing sensor on that particular wheel set.
Comparing front-left (FL) and front-right (FR) wheel temperatures makes it possible to conclude that the track runs clockwise, since the left-side wheels operate at a higher temperature, indicating they’re the car’s loaded wheels. A drop in temperature and pressure can also be seen during the race’s first stint (green line), caused by reduced heat generation from a slower lap pace under safety car.
Programming languages
Using VBA, MATLAB, Python, or any other programming language allows for complete customization of the report, though these require a high level of user knowledge to fully unlock their potential.
Python is a powerful and popular programming language that can be used to build KPIs in motorsport. With specialized libraries such as pandas and NumPy, it’s possible to manipulate and analyze telemetry data, calculate statistics, and create visualizations of key indicators.
HH Data Management
HH Data Management is dedicated software for managing telemetry data in motorsport competition. It offers tools to import, organize, and analyze telemetry data, and includes features for calculating and building custom KPIs based on that data. HH Data Management is used by leading international teams for performance analysis.
Other approaches to building KPIs depend on exporting data to external software. With HH, the data log can be imported directly into the program, which then looks for the relevant channel to build the chart. In practice, instead of creating a math channel in the data analysis software that’s only used when generating the report, the channel is created directly within HH itself. This keeps the data analysis software’s template lighter, with fewer math channels, making it faster to use.
The programming level required is intermediate, though implementation cost is high.
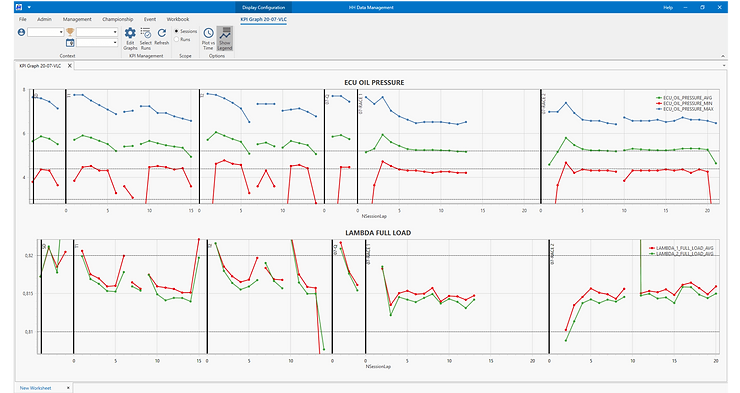
In the image above, two charts show variations in oil pressure and full-throttle lambda values across the sessions of a race weekend. The Y axis shows the vital channel values, and the X axis plots the laps of each session. Notice that the lap count increases up to the black vertical bar that cuts across the chart. This bar marks the start of a new session, with its name shown at the top. For this event, there was a shakedown (SD), two free practice sessions (P1 and P2), one qualifying session (Q), and two races (Race 1 and Race 2). The chart also includes two reference lines marking the optimal maximum and minimum values for each channel. For this vehicle, it’s desirable for oil pressure to run between roughly 4.4 and 5.2 bar, and for lambda values to stay between 0.81 and 0.82.
Working in motorsport careers means correctly implementing KPIs is essential to extracting maximum performance. Doing so leads to better lap times, greater mechanical reliability, and faster vehicle development throughout the season. Our data analysis course includes a chapter dedicated to reports and KPIs. Fill out the form to stay informed about upcoming classes.


